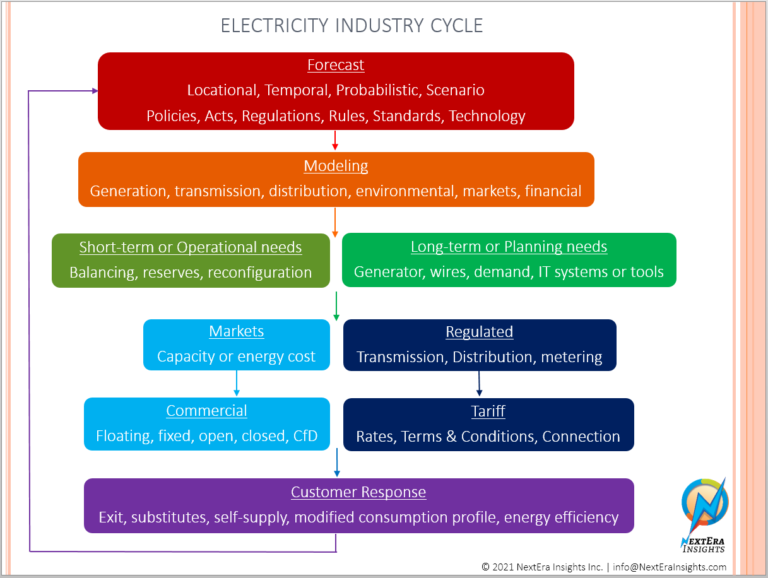
Electricity Industry Cycle
A lot goes on behind the scenes in providing round the clock electricity to all Consumers be it residential, commercial like restaurants or stores, institutions like schools or hospitals, and industrial like paper, chemical, plastic, metal, or gasoline production.
Storing electricity is not yet economic and production has to match consumption second by second.
And electricity is very valuable, with estimates ranging from $1,000/MWh to $15,000/MWh (Mega Watt Hour i.e. million joules per second for one hour).
This leads to a very robust system of planning, financing, building, operating and maintaining generation, transmission, distribution, meters, and settlement that can handle a wide variety of challenges without breaking down, second by second, year after year.
Up to now economies of scale meant generation and transmission in particular was upsized with utilization increasing over life of the asset, usually about 25 years for generation asset and about 50 years for transmission asset. This upsizing meant asset capital investment was in 100 million to a few billion dollars range.
So how does the industry, which is a mix of many companies operating in competitive markets and many companies regulated (i.e. watched over) by state/provincial and federal government agencies, profitably and sustainably manages to build these large assets and then operate in synchronization with second by second precision?
The flowchart below answers this question by visualizing the electricity industry cycle.

Good understanding of how all these areas are inter-connected and how a change in policy, process, procedure, or practice in one area can impact other areas is essential for all decision makers and senior technical professionals.
NextEra Insights has significant knowledge, experience, and insights in all these areas.NextEra Insights offers education, collaboration, and advisory services with a focus on creating value by aligning and integrating.
